| Company Insights Sat. Sep 12, 2026 Nvidia Microsoft Apple Alphabet Amazon Meta Tesla ● Earningd Releases | Uptrend Companies | Downtrend Companies |
|---|
| Company | Ticker | Price | Change | Trend | Std
Dev | Level |
|---|
| Bloom Energy | BE | $275.56 | 6.6% | 6.4 | 8.94% | 98 | | Dell | DELL | $567.14 | 11.93% | 4.7 | 6.9% | 106 | | Corning Inc | GLW | $166.36 | 1.97% | 3.7 | 5.28% | 82 | | Advanced Micro Devices | AMD | $515.2901 | 2.15% | 3.6 | 3.97% | 91 | | Intel | INTC | $102.75 | 2.22% | 3.3 | 6.06% | 83 | | QUALCOMM | QCOM | $181.88 | 2.64% | 3.1 | 3.49% | 110 | | Meta Platforms Inc. | META | $647.37 | 0.46% | 2.9 | 5.15% | 96 | | Coherent Corp. | COHR | $305.31 | 4.12% | 2.8 | 6.44% | 66 | | Moderna Inc | MRNA | $144.68 | 5.78% | 2.6 | 21.26% | 59 | | Marvell Technology | MRVL | $235.59 | 3.65% | 2.5 | 5.39% | 66 |
| | Company | Ticker | Price | Change | Trend | Std
Dev | Level |
|---|
| Amphenol | APH | $83.92 | 4.57% | -8.8 | 42.84% | 13 | | Novartis AG | NVS | $137.19 | -0.22% | -5.1 | 6.26% | 3 | | Howmet Aerospace | HWM | $229.49 | 0.67% | -5.1 | 8.51% | 9 | | Amgen | AMGN | $377.95999 | -1.25% | -5.1 | 5.65% | -6 | | Stryker | SYK | $275.57 | 2.04% | -4.8 | 8.09% | 6 | | Booking Holdings | BKNG | $173.99 | -0.18% | -4.7 | 7.74% | 3 | | Adobe Inc | ADBE | $252.77 | 1.28% | -4.2 | 5.19% | 14 | | DoorDash | DASH | $201.92 | 0.14% | -3.6 | 6.01% | 13 | | Cadence Design Systems | CDNS | $289.14 | 1.58% | -3.5 | 6.56% | 17 | | Boston Scientific | BSX | $42.96 | -0.32% | -3.4 | 5.96% | -0 |
| | | |
| | ● Netflix at $100.24: What Happened on December 5 and What’s Next? | 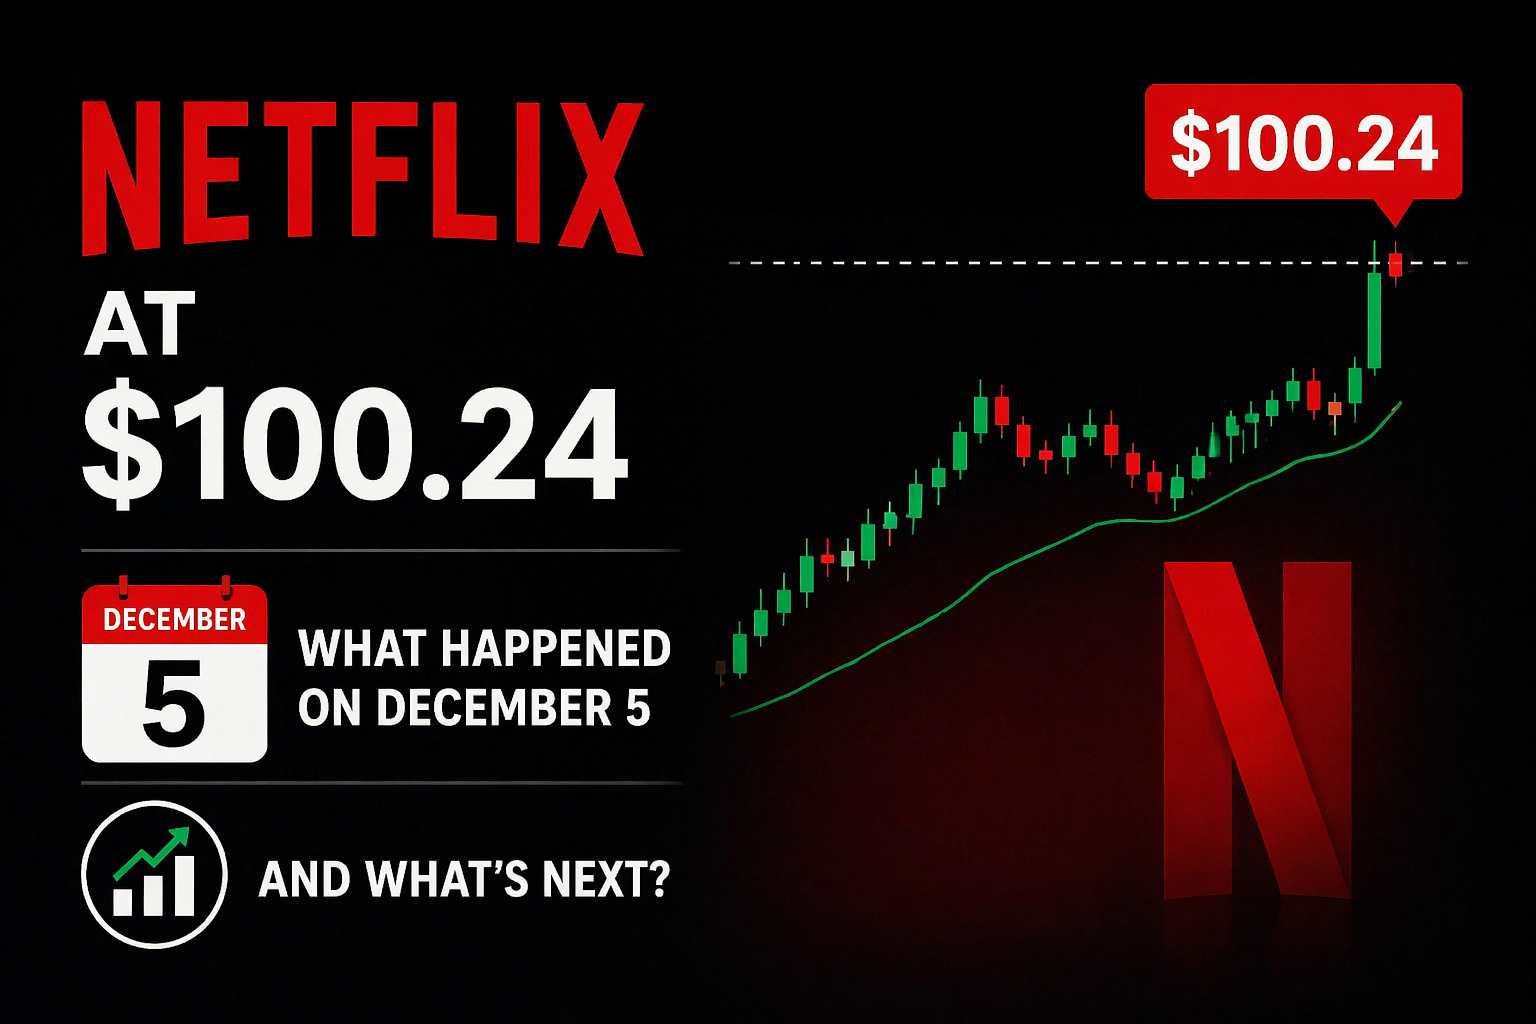 | With directional probability better than -20% and price closer to a possible short-term bottom
Sun. Dec 7, 2025
|
| | ● META’s wobble looks like a bottom: why I’m leaning long (with eyes open) | 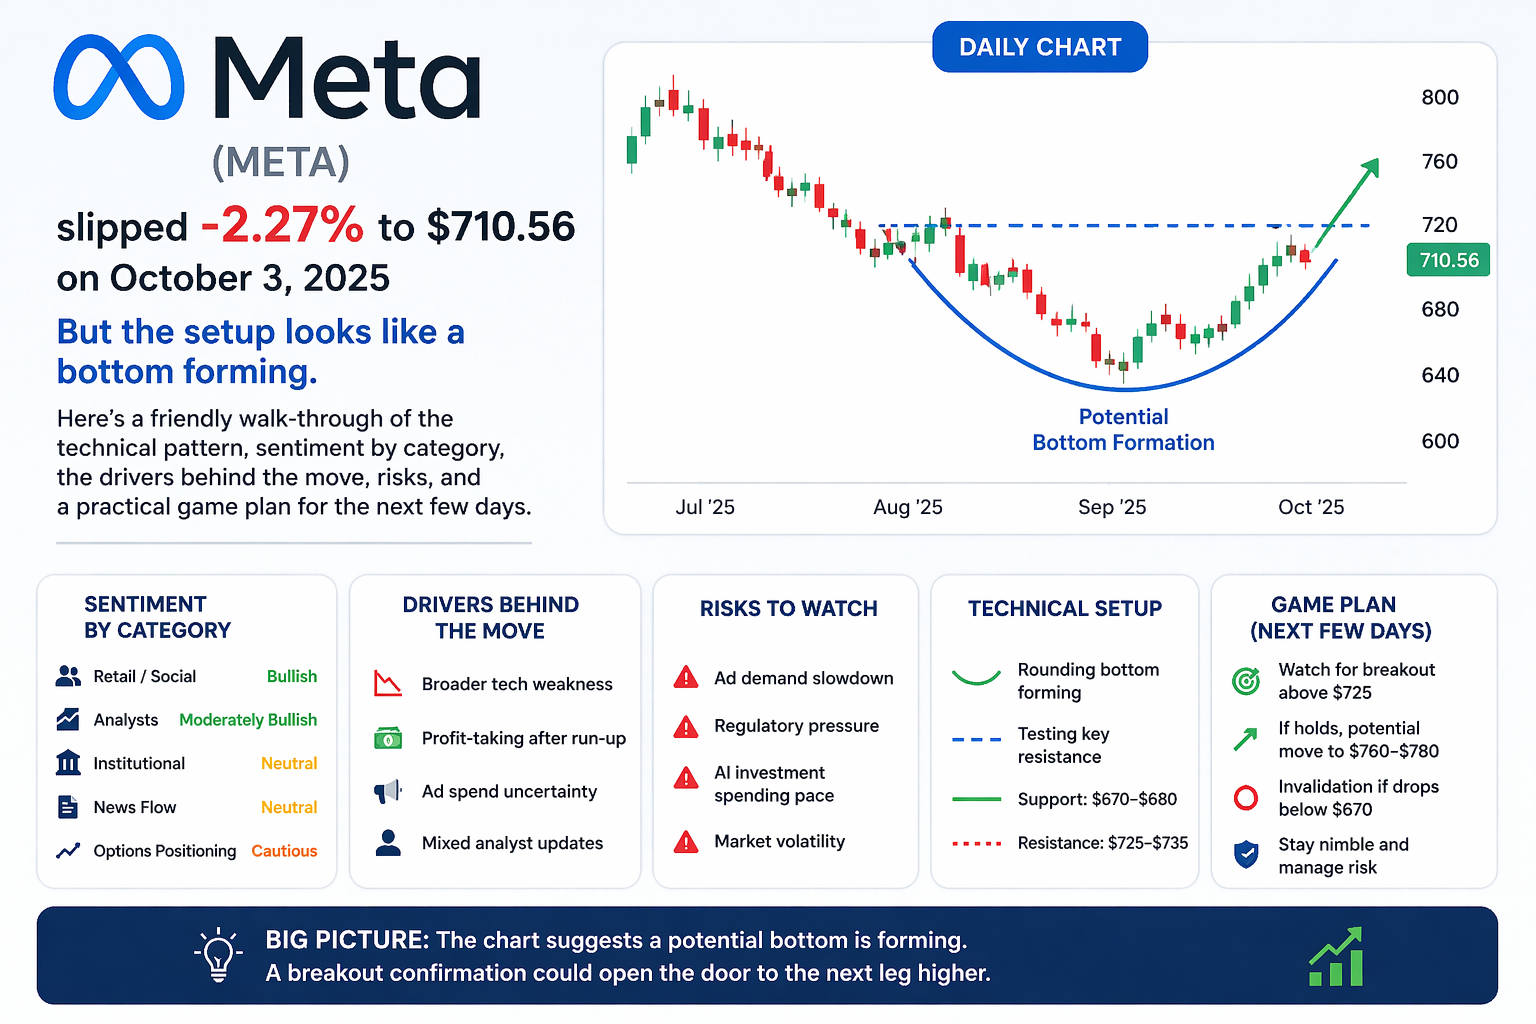 | Meta (META) slipped 2.27% to $710.56 on October 3, 2025, but the setup looks like a bottom forming. Here’s a friendly walk-through of the technical pattern, sentiment by category, the drivers behind the move, risks, and a practical game plan for the next few days.
Sun. Oct 5, 2025
|
| | ● From Lab Bench to Breakout: Why Thermo Fisher (TMO) Just Popped |  |
Wed. Oct 1, 2025
|
| | ● NVDA: A Bottom Taking Shape — Why a Near-Term Long Is Back on the Table | 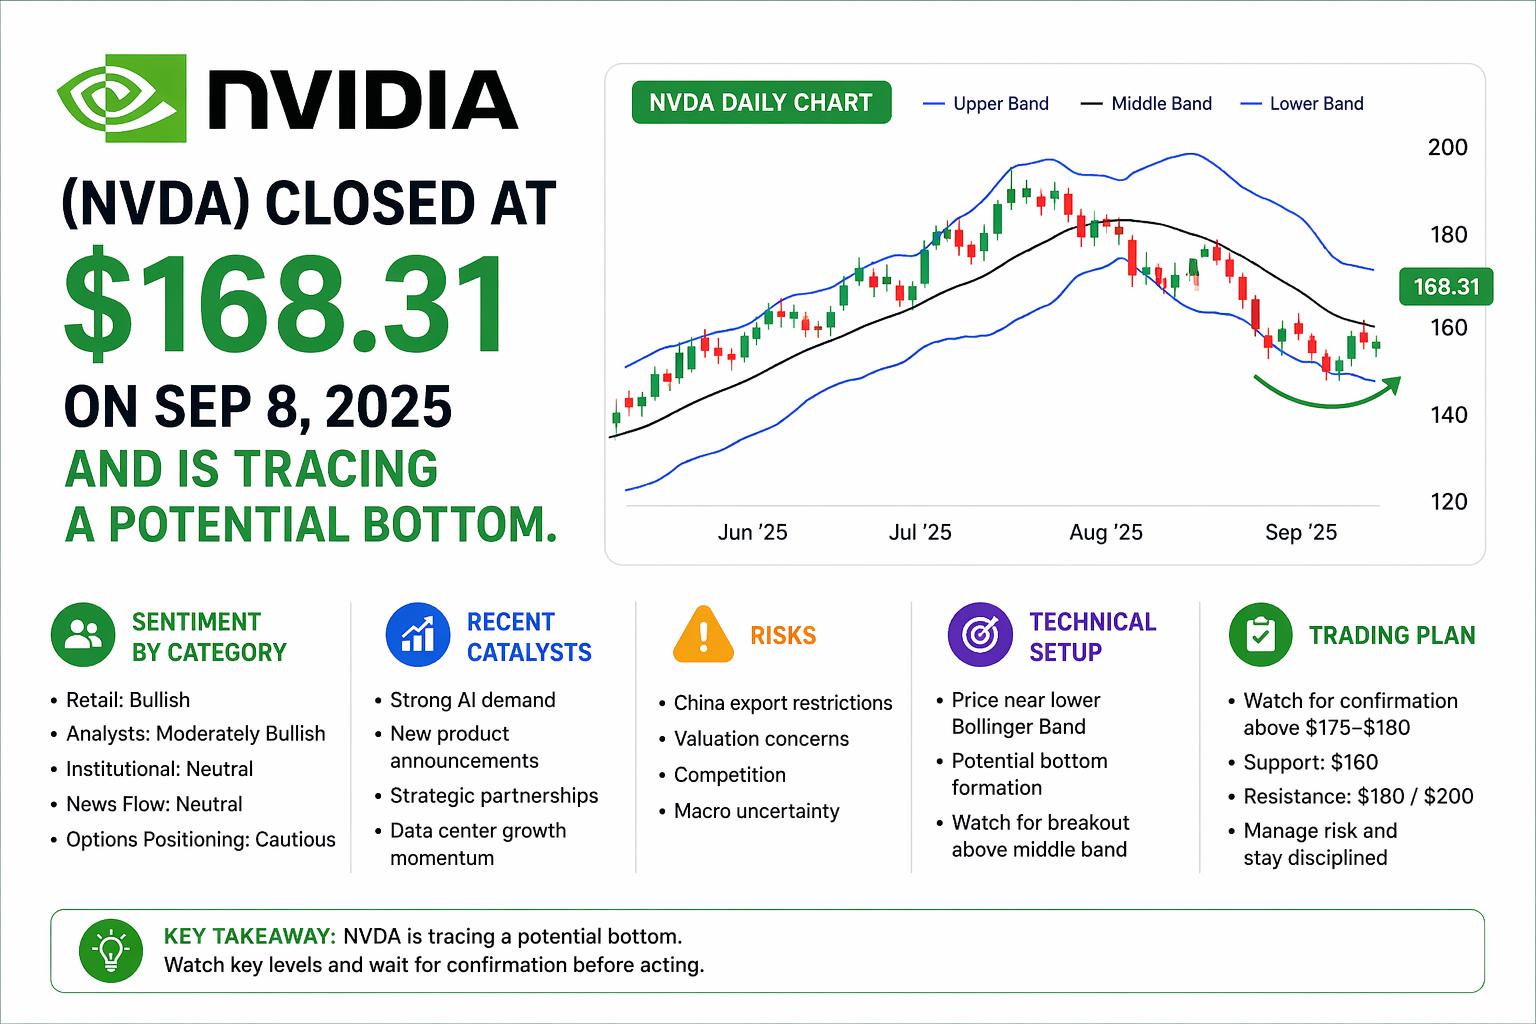 | NVIDIA (NVDA) closed at $168.31 on Sep 8, 2025 and is tracing a potential bottom. This piece reviews the technical setup with a Bollinger-Band chart, category-level sentiment, recent catalysts, risks, and a disciplined trading plan for the near term.
Mon. Sep 8, 2025
|
| | ● Intel’s Bottoming Signal: Why INTC Looks Buyable After a Rough Day | 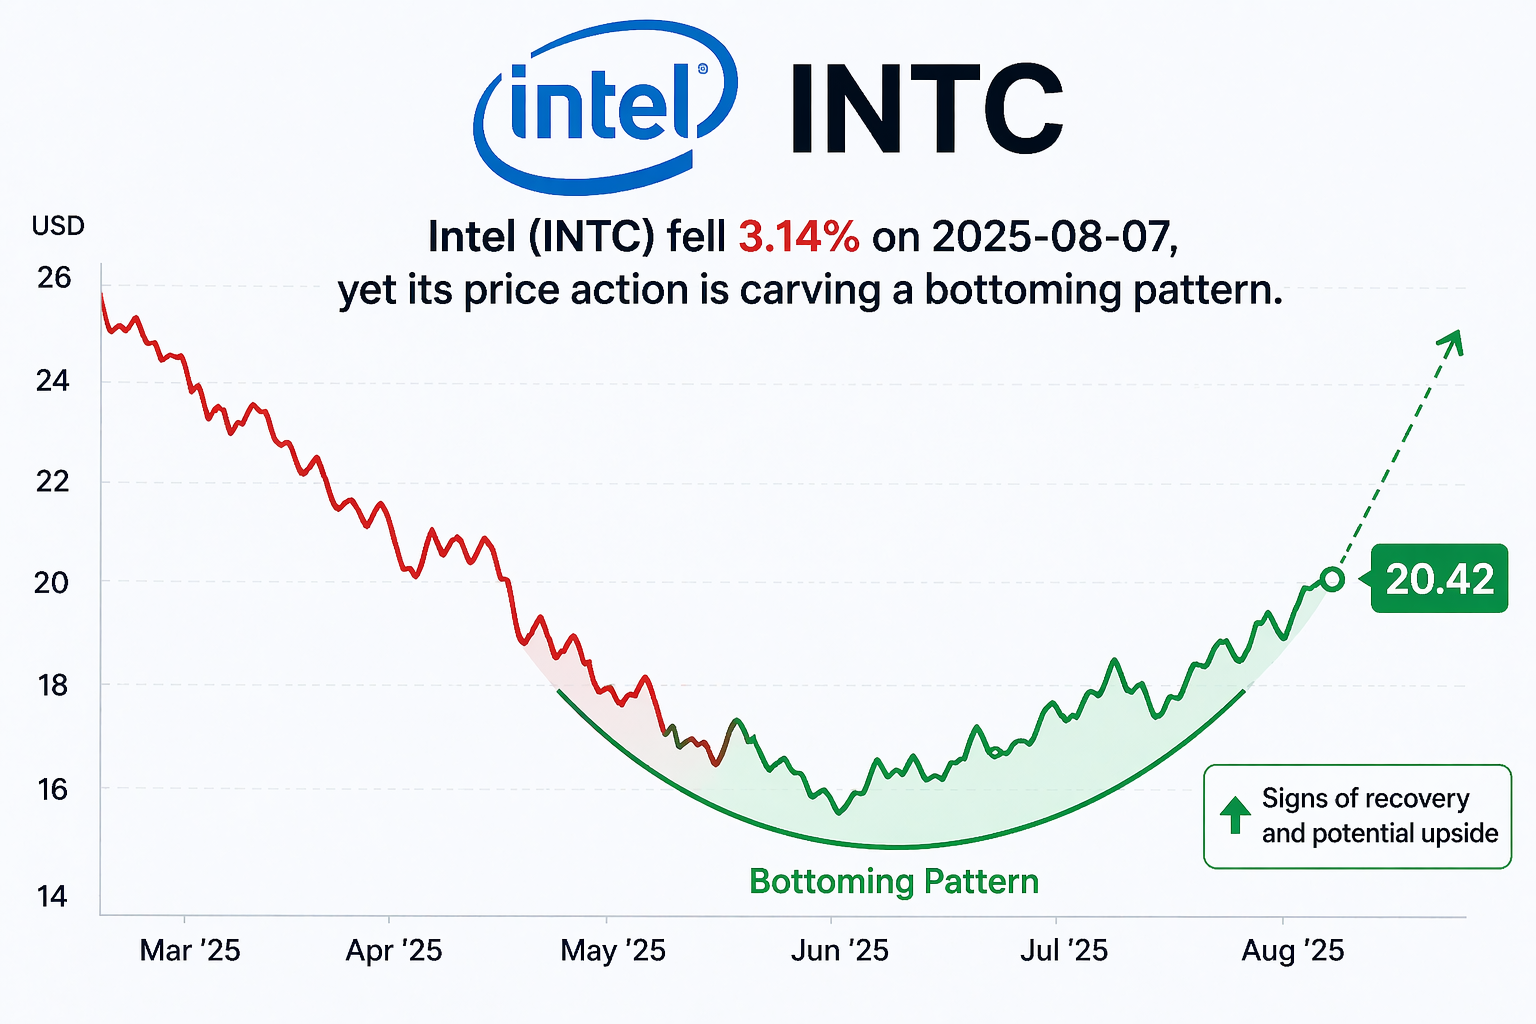 | Intel (INTC) fell 3.14% on 2025-08-07, yet its price action is carving a bottoming pattern. Here’s a friendly, data-backed walkthrough of the setup, sentiment, key events, near-term outlook, risks, and a simple trading plan—plus interactive charts to explore.
Thu. Aug 7, 2025
|
About
Contact Us
Copyright ©2025 TheMarketUnfolds. All rights reserved. Denver, Colorado, USA
|